How to Debug Kubernetes Services With VS Code and Telepresence

Local Debugging with Mocks and Stubs Only Gets You So Far
Difficulties with Debugging Node Apps Running in Kubernetes
Tutorial: VS Code + Telepresence = Easy Node.js K8s Debugging
Bonus: Loading K8s Environment Variables into VS Code
Learn More About Telepresence
Many organizations using Node.js adopt cloud native development practices with the goal of shipping features faster. The technologies and architectures may change when we move to the cloud, but the fact remains that we all still add the occasional bug to our code. The challenge here is that many of your existing local debugging tools and practices can’t be used when everything is running in a container or on the cloud. A change in approach is required!
In this article, I’ll show you how to debug Kubernetes services using Telepresence and VScode. This will enable you to still utilize your local debugging tools even though your microservice application runs remotely.
Local Debugging with Mocks and Stubs Only Gets You So Far
One of the biggest challenges when working with a microservice system is spinning up all of your services locally when testing and debugging. Once you get to a certain number of services it becomes physically impossible to run these via a local Kubernetes cluster like minikube or Kind.
The first approach often taken is to create mocks, stubs, or doubles, perhaps using something library-based like Jest, or something out of process like Mountebank. Although valuable, these doubles can often encode incorrect assumptions, or they diverge over time against the real implementation. Often you are forced to sacrifice realistic testing compared to what is running within your production environment, and you end up pushing code to production with uncertainty.
In an ideal world, you would be testing against all of your services running in a cluster. Accordingly, the next approach engineers take is to attempt to remotely debug their services running in a remote cluster. Often this cluster is shared; perhaps each team has its own cluster, or maybe you are using a communal staging or pre-production cluster.
Difficulties with Debugging Node Apps Running in Kubernetes
Remote debugging against node.js apps running in Kubernetes can be challenging. The primary issue is exposing the debug ports for your locally running IDE or debugger to connect to. You can expose the port in your Kubernetes Service YAML, but this can be a security risk if this is deployed to production, so you typically have to maintain two copies of the YAML when using this approach. You can use
kubectl port-forwardAs an alternative, you can spin up a local copy of the service under test and attempt to use
kubectl port-forwardTelepresence can be used to overcome both of these challenges. By setting up a two way proxy between your local machine and remote Kubernetes cluster you can debug Kubernetes services locally as if they were running in the cluster i.e. your service can connect to other remote services simply using the k8s Service names and ports. Telepresence also allows the easy exporting of environment variables, which you can load into your local IDE or debugger.
Let’s now walk through a worked example of how to set all of this up.
Tutorial: VS Code + Telepresence = Easy Node.js K8s Debugging
Step 1: Deploy a Sample Microservice Application
In this tutorial, we’ll build on a sample application that was introduced in a previous article. All the instructions you need to debug the “DataProcessingService” node.js application are included in the article you are now reading. We assume you have access to a Kubernetes cluster, either a remote cluster or something like minikube running locally that you can pretend is a remote cluster. We also assume you have a current version of Node installed, alongside VS Code.
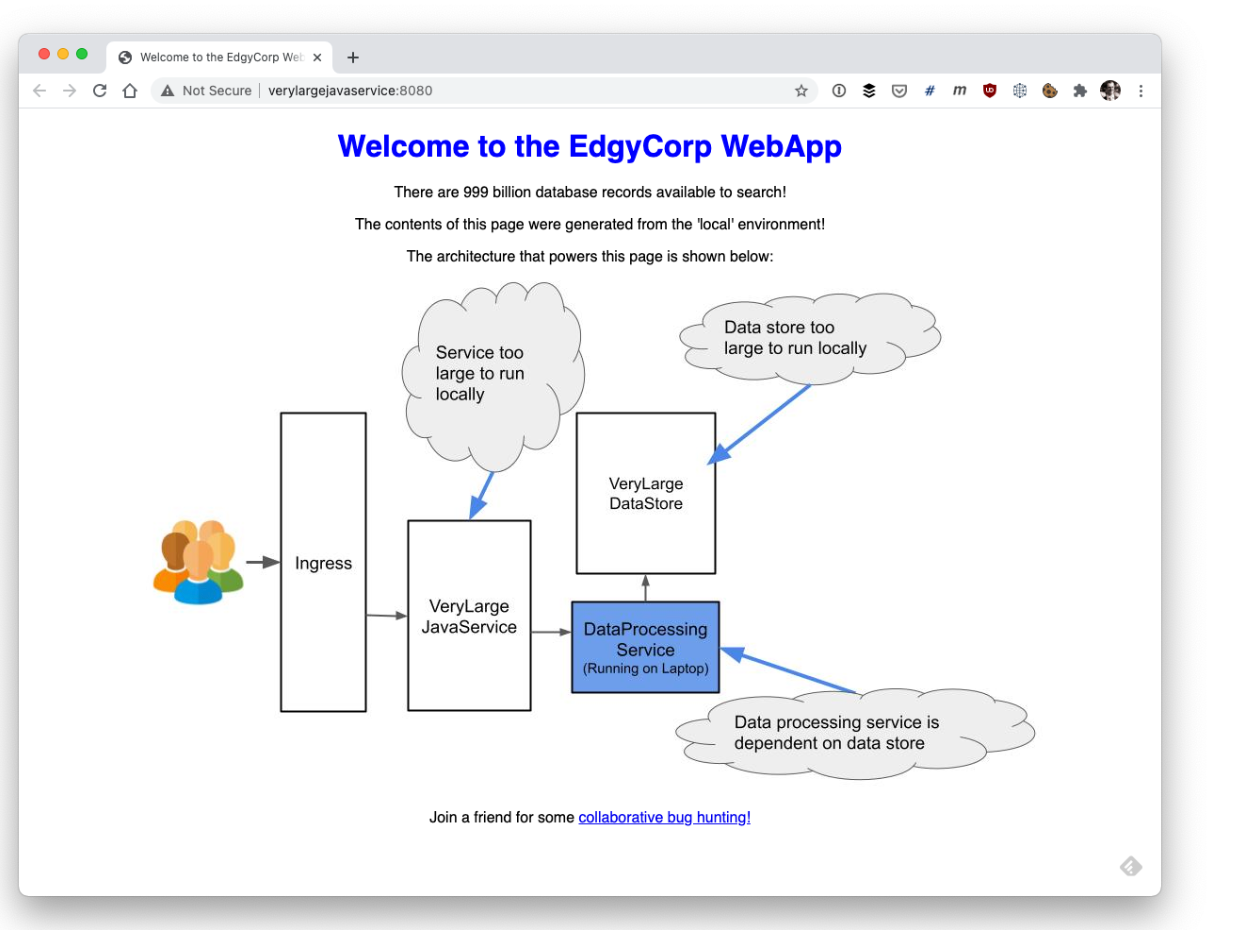
You can find a detailed explanation of each service in the original article, and the architecture diagram below should provide a high-level overview of the dependencies between services:
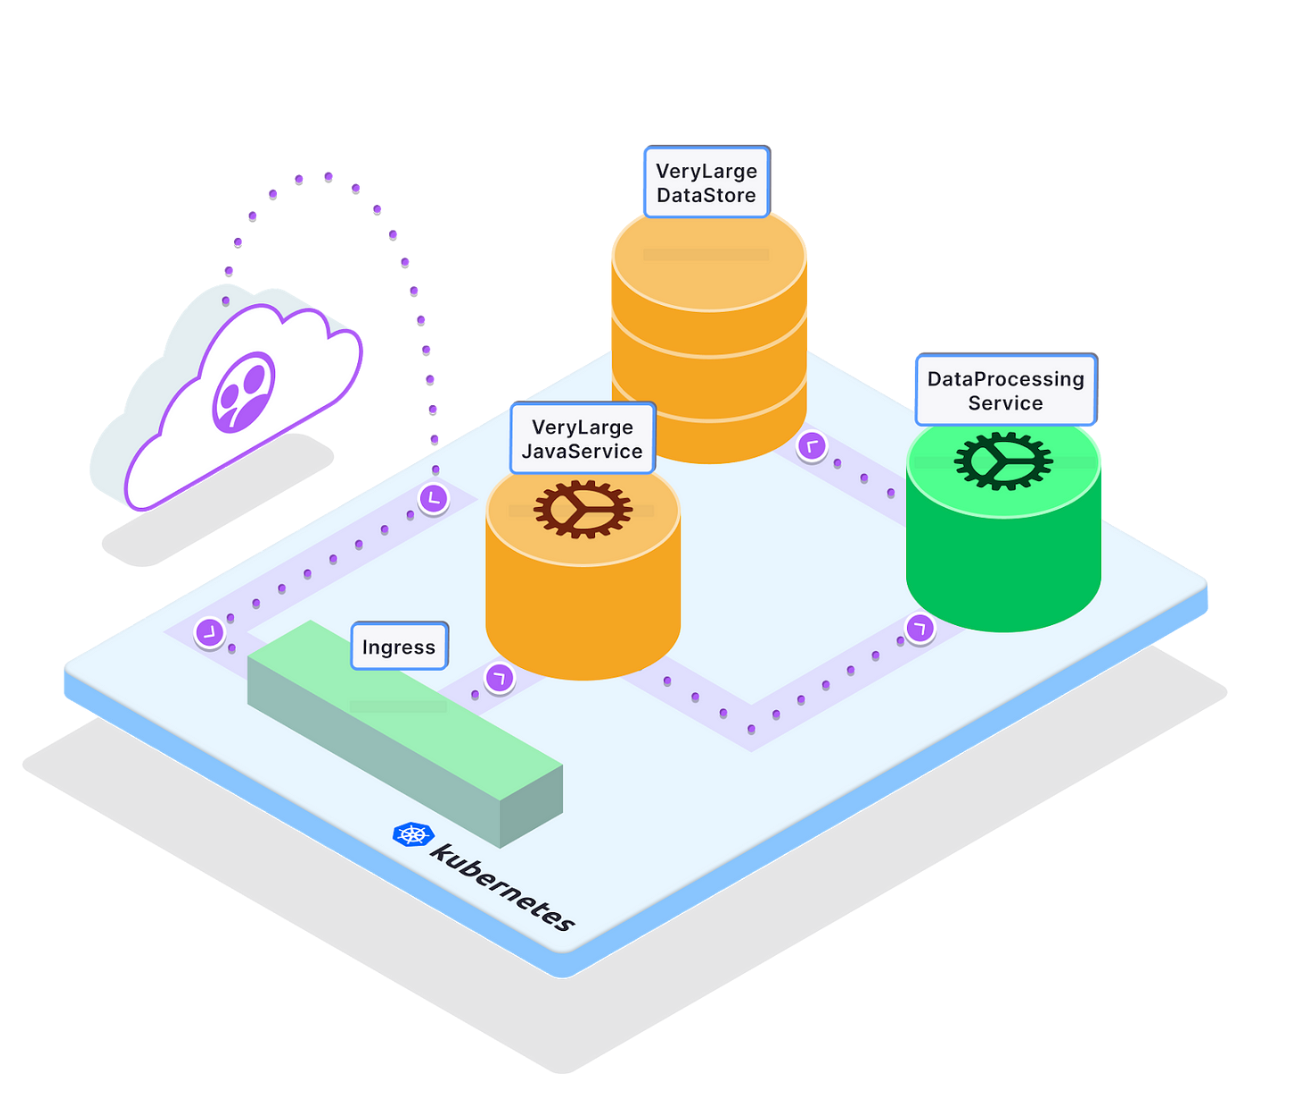
In this architecture diagram, you’ll notice that requests from users are routed through an ingress controller to our services. For simplicity’s sake, we’ll skip the step of deploying an ingress controller in this tutorial. If you’re ready to use Telepresence in your own setup and need a simple way to set up an ingress controller, we recommend checking out the Edge Stack API Gateway.
First, let’s deploy the sample application to your Kubernetes cluster:
kubectl apply -f https://raw.githubusercontent.com/datawire/edgey-corp-nodejs/main/k8s-config/edgey-corp-web-app-no-mapping.yamlIf you run
kubectl get servicekubectl get serviceNAME TYPE CLUSTER-IP EXTERNAL-IP PORT(S) AGEdataprocessingservice ClusterIP 10.3.255.141 <none> 3000/TCP 5skubernetes ClusterIP 10.3.240.1 <none> 443/TCP 17mverylargedatastore ClusterIP 10.3.241.162 <none> 8080/TCP 4sverylargejavaservice ClusterIP 10.3.243.172 <none> 8080/TCP 4s
Step 2: Set up your Local Node.js Development Environment and VS Code
You will need to configure your local development environment to debug the
DataProcessingServiceDataProcessingServiceVeryLargeJavaServiceVeryLargeDataStoreVeryLargeJavaServiceVeryLargeDataStoreSo, let’s get started with using our new approach to debugging!
- Clone the repository for this application from GitHub.
git clone https://github.com/datawire/edgey-corp-nodejs.git
2. Navigate into the directory and install the dependencies via NPM
npm install3. After NPM has finished downloading the dependencies, start VS Code and select “Open” from the “Welcome” screen. Navigate to the
DataProcessingService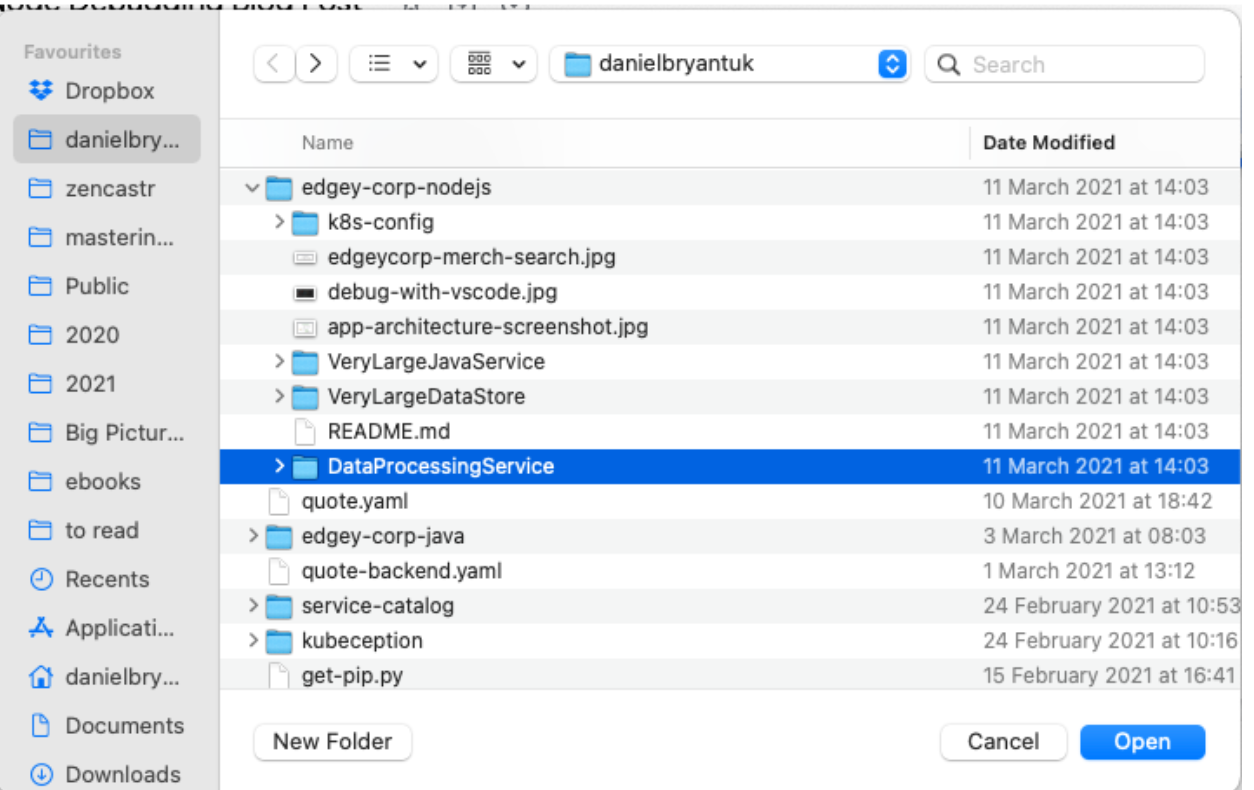
4. After the project loads into VS Code, open the
app.js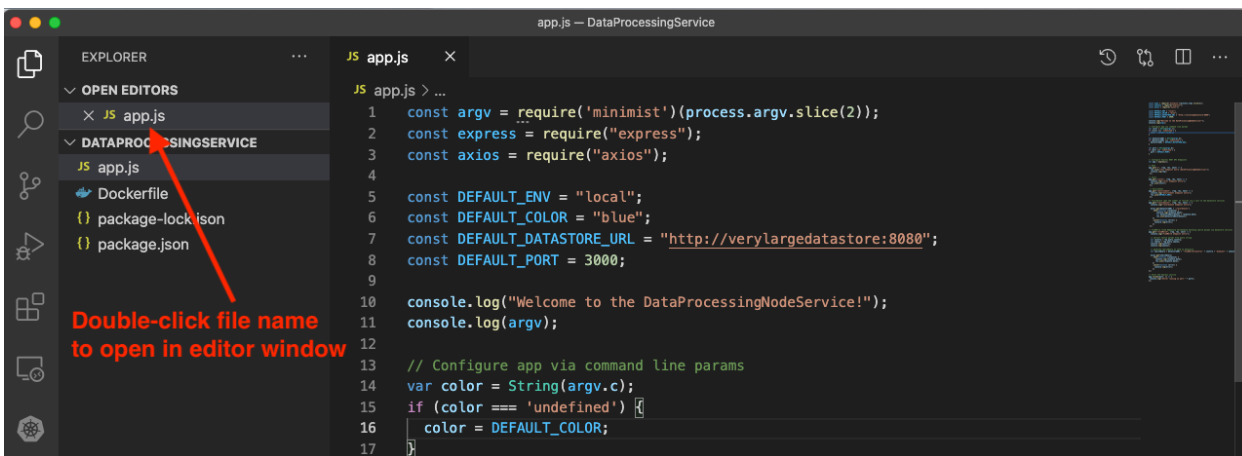
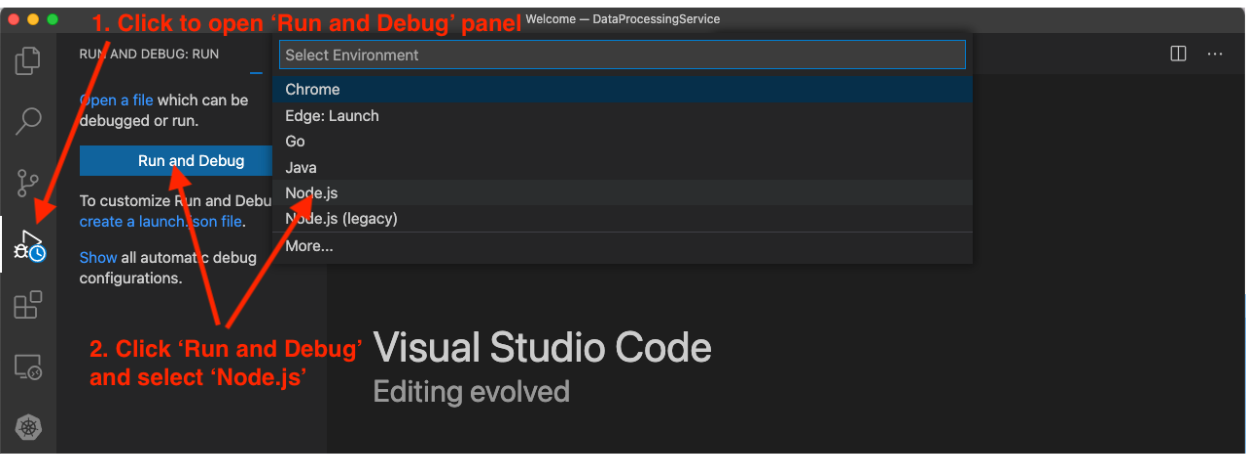
5. Start the application in debug mode by clicking on ‘Run and Debug’ icon in the left side navigation pane, and then clicking the ‘Run and Debug’ button and selecting ‘Node.js’ from the dropdown menu that is shown.
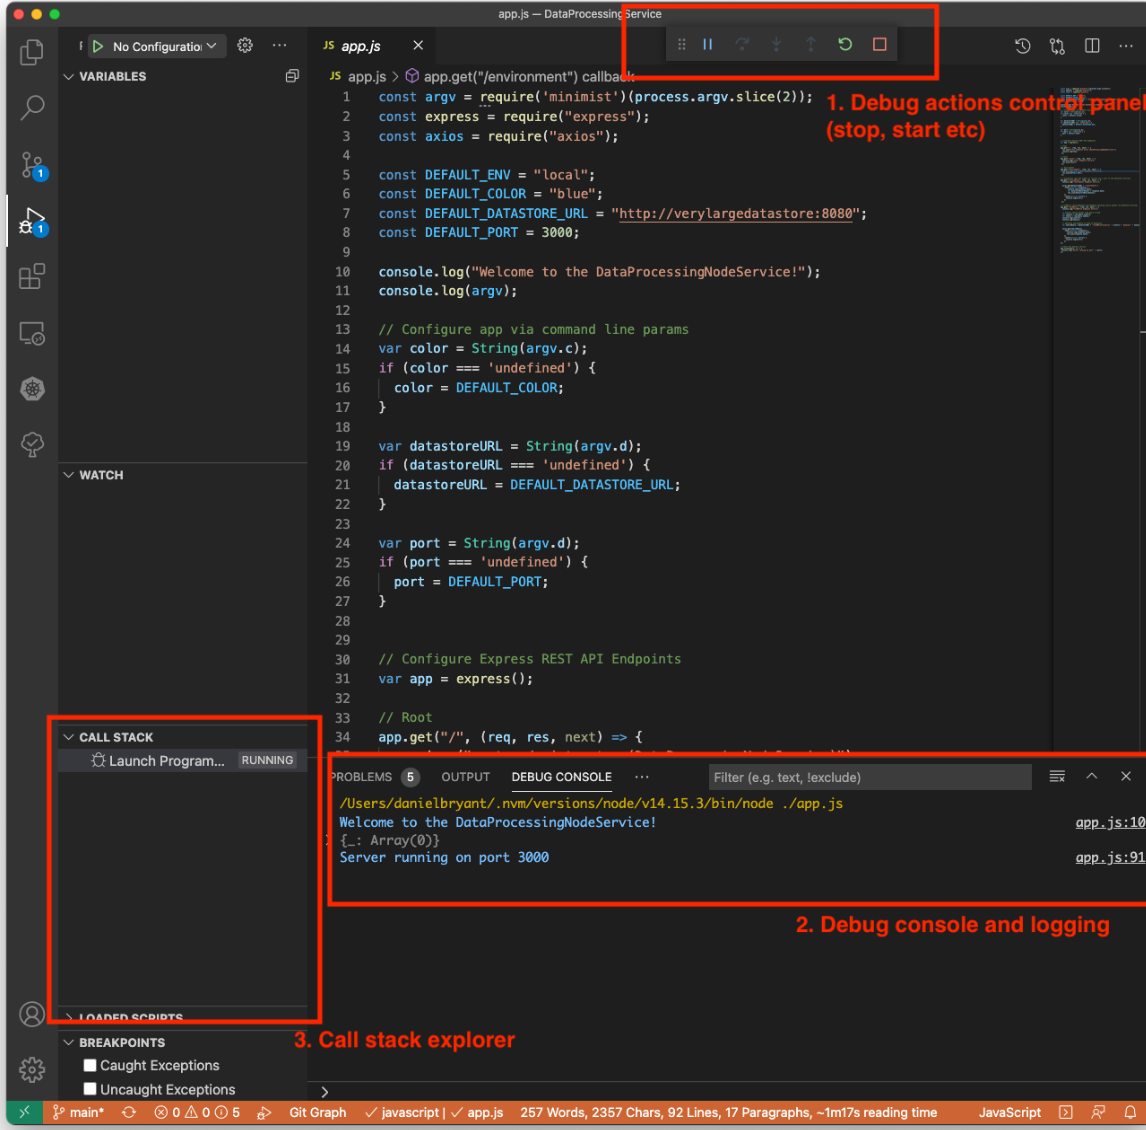
6. The application will start in debug mode, and the (1) debug control panel is shown, alongside the (2) debug console (where application logging will be shown) and the (3) call stack explorer
7. In a terminal window, type the command curl
localhost:3000/color$ curl localhost:3000/color“blue”You now have your local service loaded into your IDE and running in debug mode! Now connect this to the remote Kubernetes cluster.
Step 3: Install and Configure Telepresence
Instead of fiddling with remote debugging protocols and exposing ports via
kubectl port-forward- Install Telepresence CLI (macOS version). See the documentation for a Linux version.
# Mac OS Xsudo curl -fL https://app.getambassador.io/download/tel2/darwin/amd64/latest/telepresence -o /usr/local/bin/telepresence#Linuxsudo curl -fL https://app.getambassador.io/download/tel2/linux/amd64/latest/telepresence -o /usr/local/bin/telepresence2. Make the binary executable
sudo chmod a+x /usr/local/bin/telepresence3. Test Telepresence by connecting to the remote cluster
telepresence connect4. Send a request to the remotely running
DataProcessingService“green”5. Notice two things here:
A. You can refer to the remote Service directly via its internal cluster name as if your development machine is inside the cluster
B. The color returned by the remote
DataProcessingServiceGreat! You’ve successfully configured Telepresence. Right now, Telepresence is “intercepting” (discussed below) the request you’re making to the Kubernetes API server, and routing over its direct connection to the cluster instead of over the Internet.
Step 4: Intercept Remote Traffic and Debug Your Local Kubernetes Service
An intercept is a routing rule for Telepresence. You can create an intercept to route all traffic intended for the
DataProcessingServiceDataProcessingServiceCreate the intercept
telepresence intercept dataprocessingservice — port 3000You will see something similar to the following output:
Using deployment dataprocessingserviceinterceptedIntercept name : dataprocessingserviceState : ACTIVEDestination : 127.0.0.1:3000Volume Mount Error: macFUSE 4.0.5 or higher is required on your local machineIntercepting : all TCP port connections
Access the application directly with Telepresence. Visit http://verylargejavaservice:8080 in your browser. Again, Telepresence is intercepting requests from your browser and routing them directly to the Kubernetes cluster. You should see a web page that displays the architecture of the system you have deployed into your cluster:
Note that the color of the title and
DataProcessingServiceDataProcessingServiceWithin VS Code, scroll the editor window with the
app.jsDataProcessingService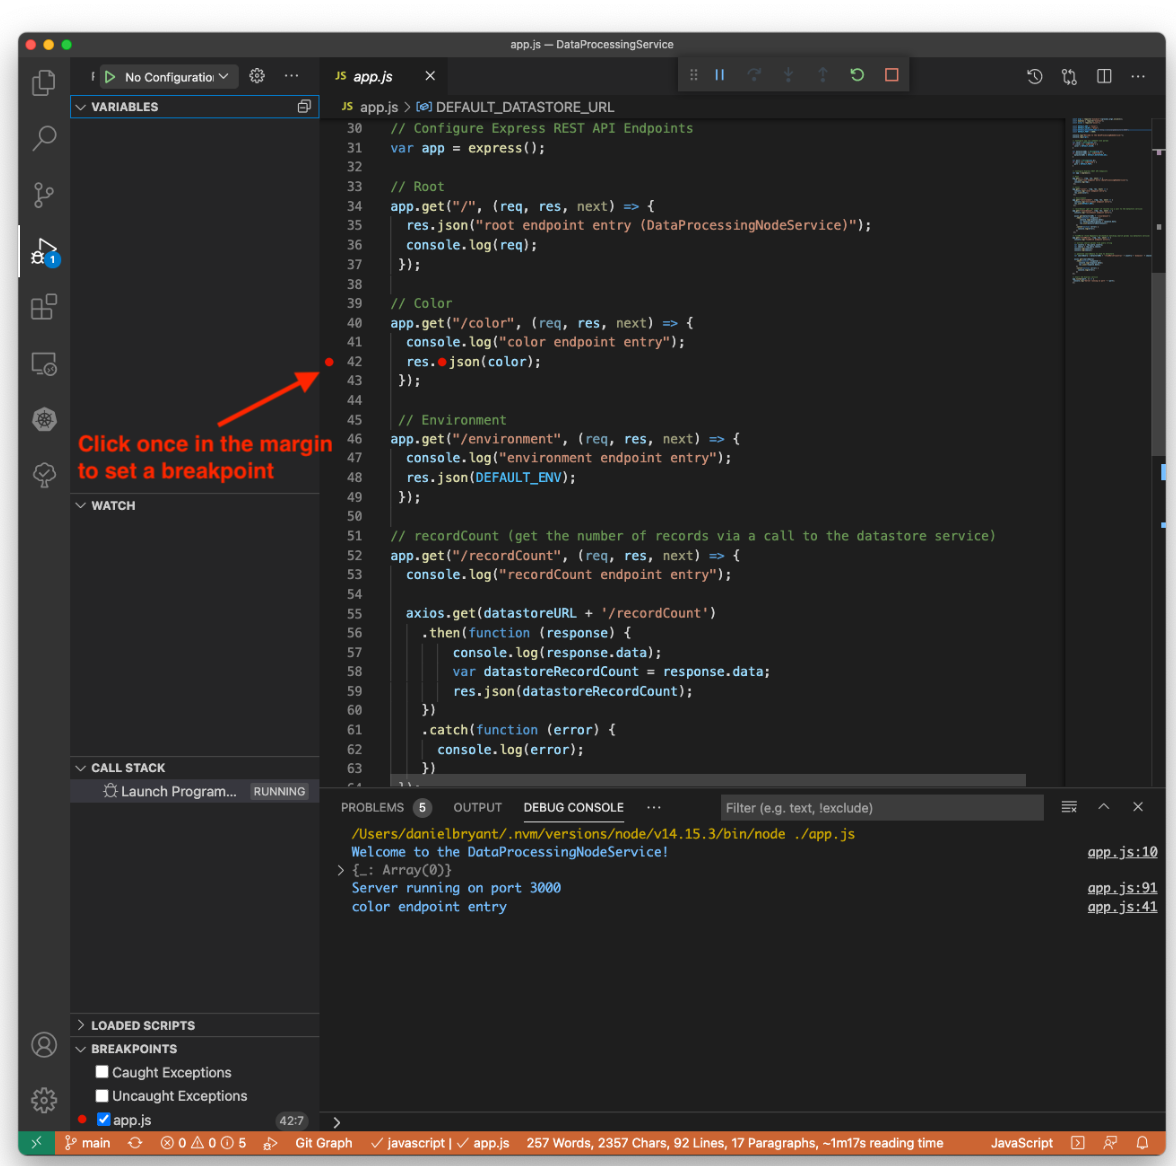
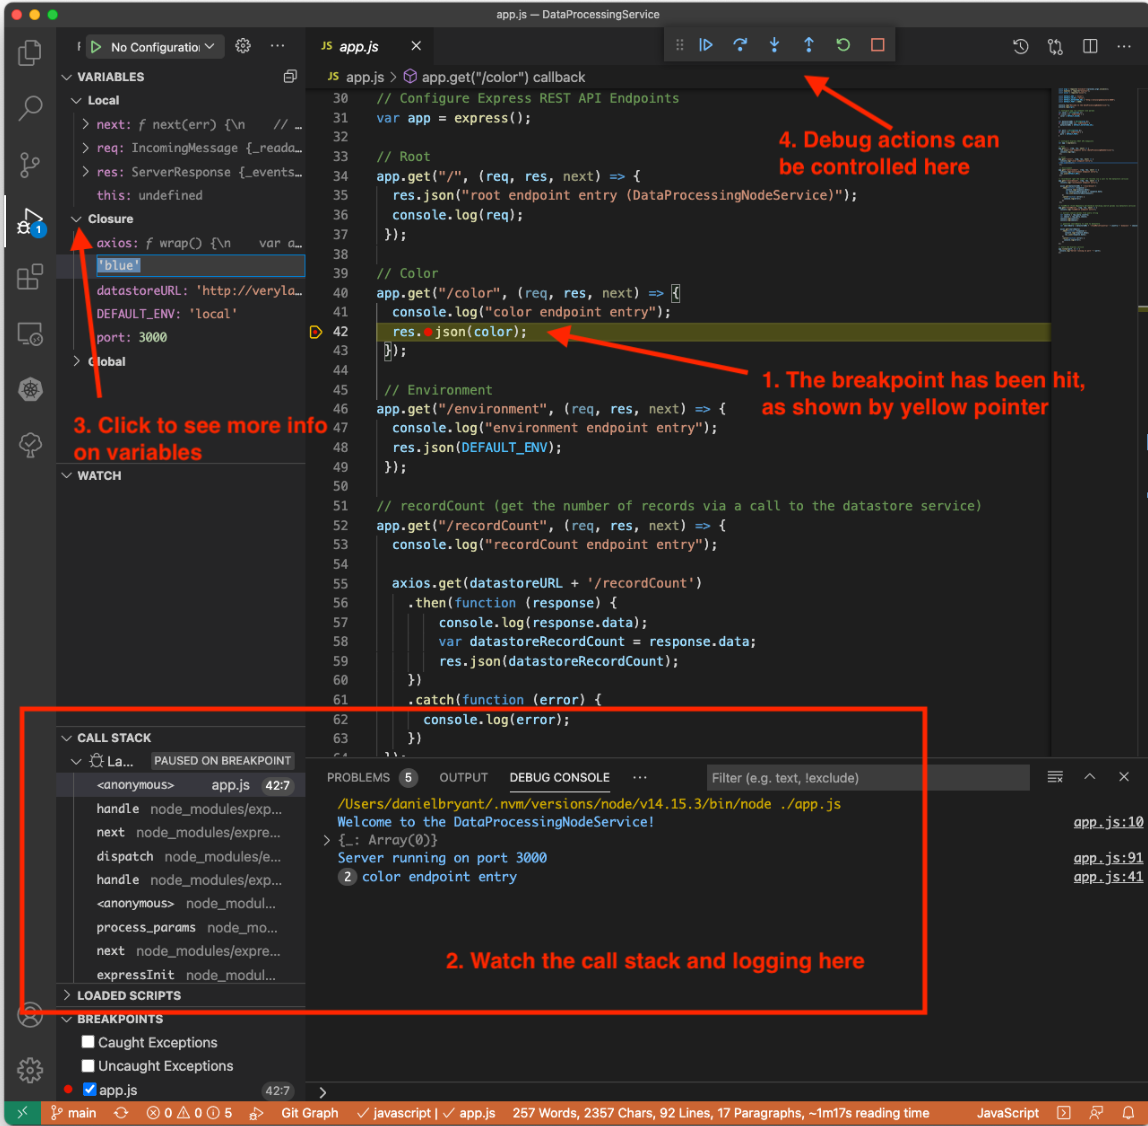
In your browser, visit http://verylargejavaservice:8080 again. Notice how VS Code immediately jumps to the foreground on your desktop with the (1) breakpoint hit. You can view the (2) call stack in the bottom left corner of the Debug window, and you can also see the (3) current variables involved with the execution of this service in the “Variables” panel to the left of the editor window.
At this point, you can perform all of the debug actions you typically can, e.g. inspecting variable values, changing variables, (4) stepping through and over code, and halting execution.
In the Variables pane on the left side of the screen, click once on the “Closure” section to expand the list of variables shown (3 in the image above).
Locate the color variable and double-click on the value ‘blue’. This should be editable. Change this value to ‘orange’ and press enter (1, below). Next, click the “Continue” icon in the debug control panel (2).
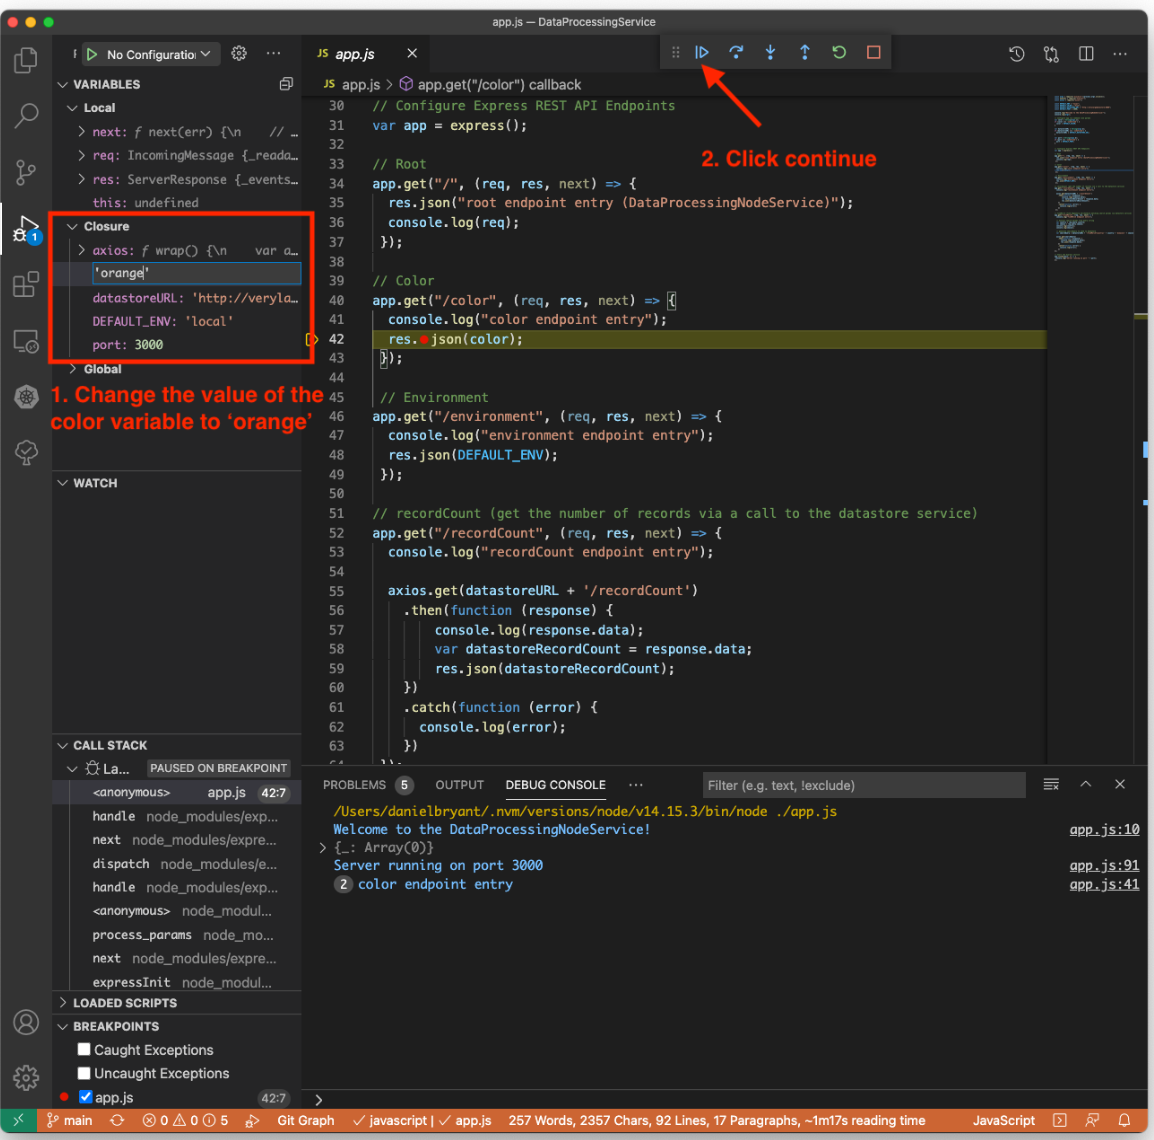
Your browser window should complete reloading and display an orange color for the title and
DataProcessingServiceSuccess! You have successfully made a request to the remote
VeryLargeJavaServiceDataProcessingServiceIn addition to rapidly inspecting and changing variables locally, you can also step through the execution of the local service as if it were running in the remote cluster. You can view data passed into the local service from the service running in the remote cluster and interact with other services running in the cluster as if you were also running here.
Bonus: Loading K8s Environment Variables into VS Code
Telepresence also allows you to locally access the environment variables your service has access to in the remote cluster. This is useful if you store essential configuration in Kubernetes environment variables for service discovery, selection of runtime profile names, feature flag config, etc.
You can leave the intercept you created above and modify the Telepresence command line flags to export the environment variables into an env formatted file:
telepresence leave dataprocessingservicetelepresence intercept dataprocessingservice — port 3000 — env-file=my-envs.envUsing deployment dataprocessingserviceinterceptedIntercept name : dataprocessingserviceState : ACTIVEDestination : 127.0.0.1:3000Volume Mount Error: macFUSE 4.0.5 or higher is required on your local machineIntercepting : all TCP port connections$ head my-envs.jsonDATAPROCESSINGSERVICE_PORT=tcp://10.3.255.141:3000DATAPROCESSINGSERVICE_PORT_3000_TCP=tcp://10.3.255.141:3000DATAPROCESSINGSERVICE_PORT_3000_TCP_ADDR=10.3.255.141DATAPROCESSINGSERVICE_PORT_3000_TCP_PORT=3000DATAPROCESSINGSERVICE_PORT_3000_TCP_PROTO=tcpDATAPROCESSINGSERVICE_SERVICE_HOST=10.3.255.141DATAPROCESSINGSERVICE_SERVICE_PORT=3000KO_DATA_PATH=/var/run/koKUBERNETES_PORT=tcp://10.3.240.1:443KUBERNETES_PORT_443_TCP=tcp://10.3.240.1:443
This env file can be loaded into VS Code by clicking on the Launch dropdown, selecting “Add Configuration”, and then selecting “Node.js” from the “Select Environment” dropdown that is shown.
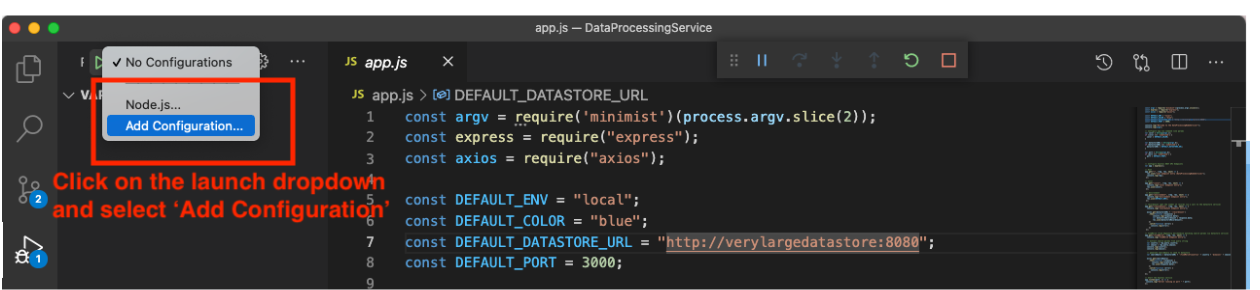
A new ‘launch.json’ file is created and opened in the editor. VS Code uses this file to configure the local debug environment.
Locate the ‘program’ properties within the
launch.jsonenvFileDataProcessingService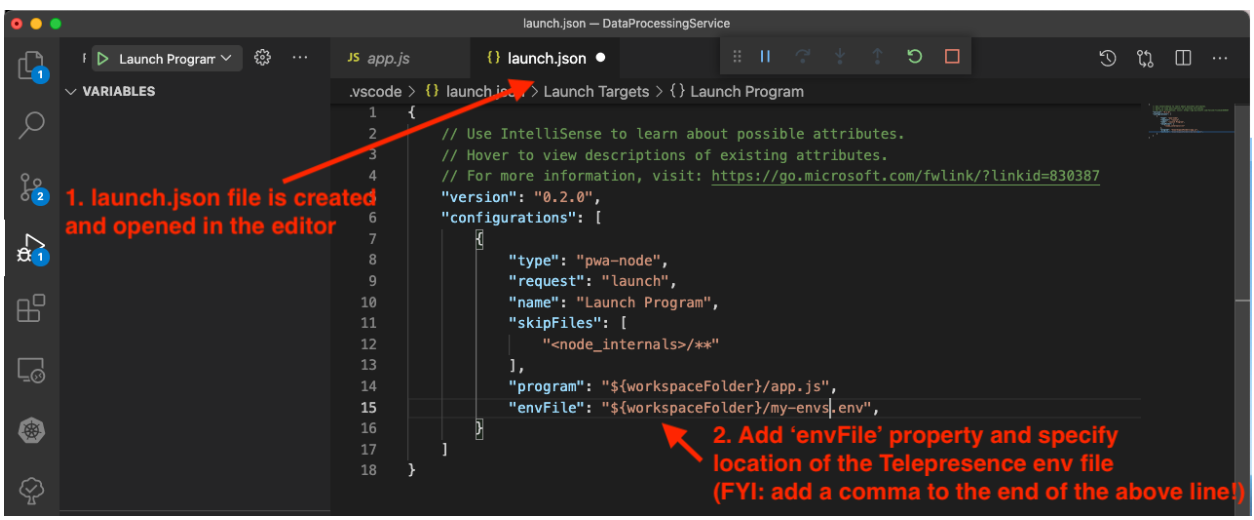
Once you have added the envFile property, you will need to stop and start the debug process (simply reloading the debug process will not provide the expected results). Now the application you are debugging can read the environment variables as if this process was running within the remote cluster.
Here is an example of adding a variable watch for the
DATAPROCESSINGSERVICE_PORT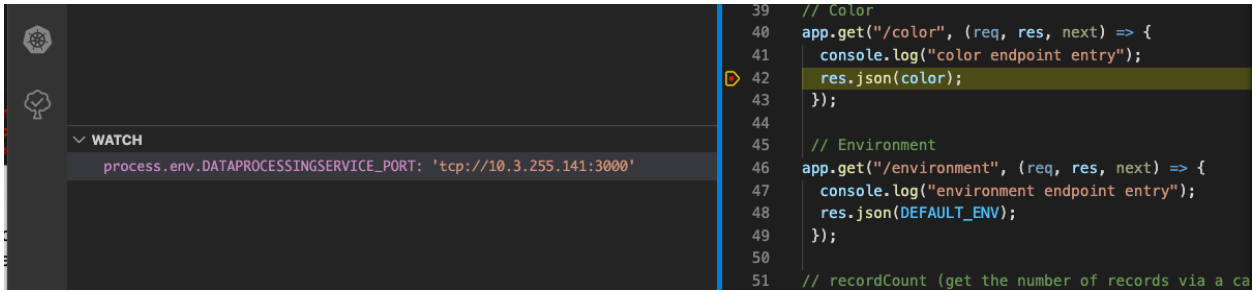
You can also locally access volumes mounted into your remote Services with Telepresence. This is useful if you are storing configuration, tokens, or other state required for the proper execution of the service. We’ll cover this in more detail in a future tutorial.
Learn More About Telepresence
In this article, you’ve learned how to use Telepresence to easily debug Kubernetes services. Now, instead of trying to mock out dependencies or fiddle around with remote debugging, you can iterate quickly with an instant feedback loop when locally debugging using your favorite IDE and tools.